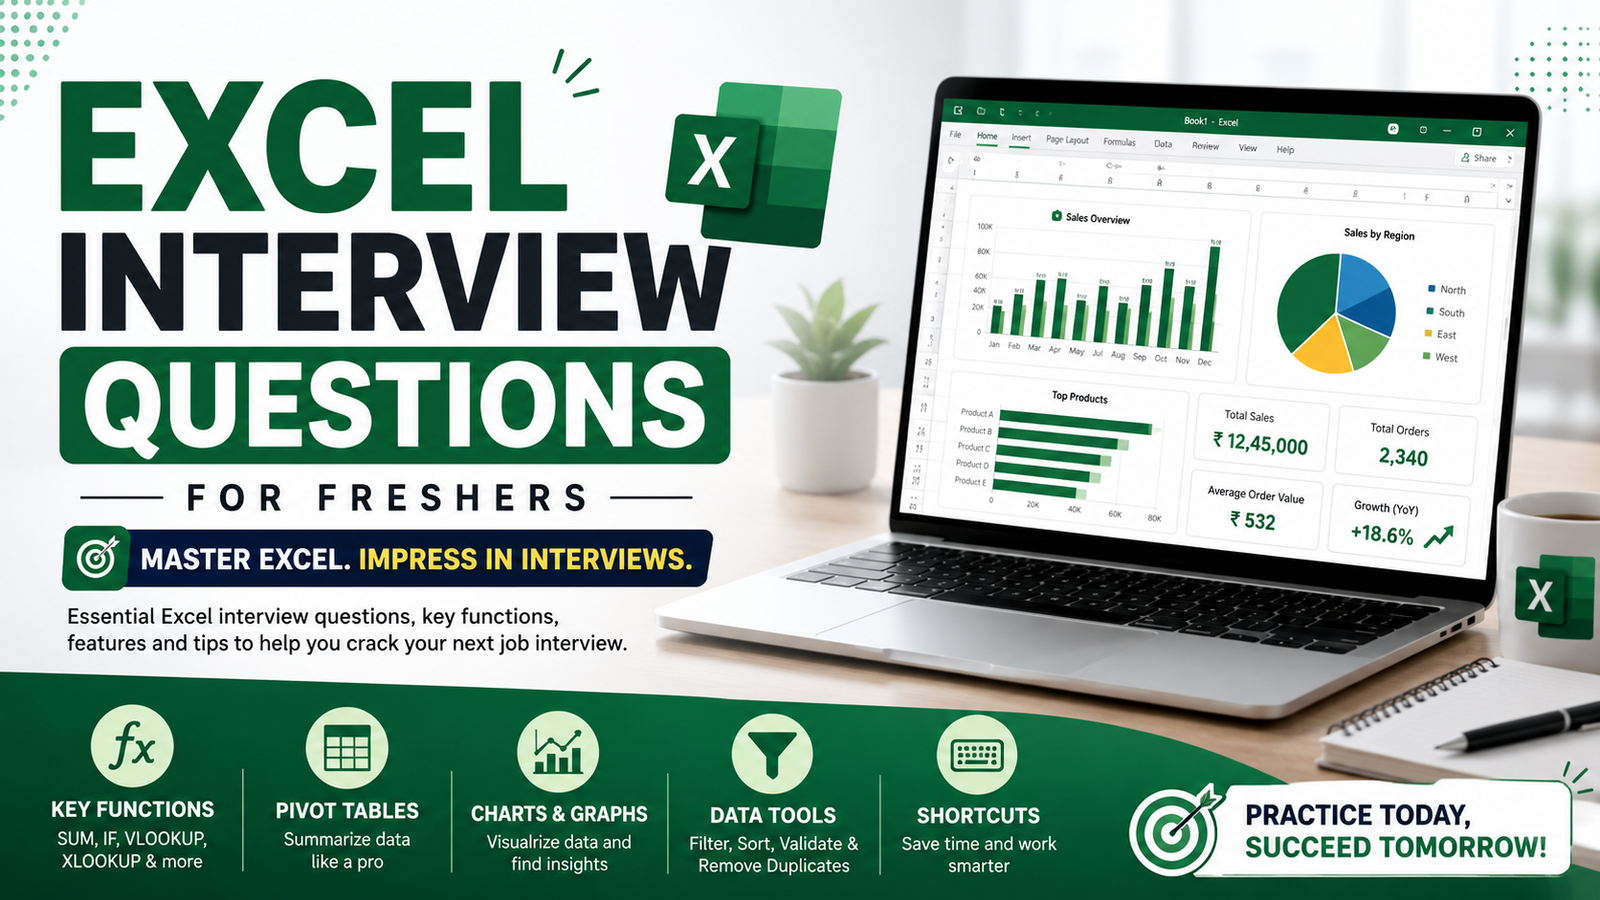
Microsoft Excel has remained one of the most valuable workplace tools for decades. Whether you are applying for a role in finance, operations, marketing, human resources, data analysis, or administration, employers often include an Excel assessment during the hiring process.
The reason is simple. Almost every organization stores, manages, and analyzes information in spreadsheets. Someone who understands MS-Excel can organize thousands of records, identify trends, prepare reports, and support better business decisions.
If you are preparing for your first interview or planning a career change, this guide explains the Excel concepts recruiters frequently test and how you should answer them.
What Do Recruiters Want to Know?
Most interviewers are not looking for someone who has memorized every Excel function. Instead, they want to know whether you can solve everyday business problems using Excel.
For example, can you calculate monthly sales? Can you clean a customer database? Can you prepare a summary report for a manager? Can you quickly find missing information in thousands of records?
Your answers should always connect Excel features to practical business use.
Question 1: How would you explain Microsoft Excel to someone who has never used it?
A good answer focuses on purpose rather than definition.
You can say that Microsoft Excel is software used to organize information into tables, perform calculations automatically, analyze large amounts of data, and create visual reports using charts and dashboards. Businesses rely on it because it saves time and improves accuracy compared to manual calculations.
Question 2: Why is Excel still important when companies use advanced software?
This is becoming a popular interview question.
Although organizations use ERP systems, CRMs, and business intelligence platforms, Excel remains the easiest tool for quick analysis, reporting, budgeting, forecasting, and sharing data. Employees often export information from different systems into Excel before creating reports or performing calculations.
Question 3: What is the difference between a workbook and a worksheet?
Many freshers confuse these terms.
Think of a workbook as a book.
Each page inside that book is called a worksheet.
One workbook may contain separate worksheets for sales, inventory, employee records, expenses, and profits.
Question 4: Which Excel functions should every beginner know?
Rather than listing dozens of functions, explain their purpose.
For example:
- SUM adds numbers.
- AVERAGE calculates the mean.
- IF helps make logical decisions.
- COUNTIF counts records matching a condition.
- SUMIF totals values based on criteria.
- XLOOKUP retrieves information from another table.
- IFERROR replaces error messages with meaningful output.
Interviewers appreciate candidates who understand where these functions are used rather than simply naming them.
Question 5: When would you use the IF function?
Imagine your manager asks you to determine whether employees achieved their monthly sales target.
Instead of checking each record manually, the IF function can automatically display “Achieved” or “Not Achieved” based on the target value.
This demonstrates how Excel reduces repetitive work.
Question 6: Why has XLOOKUP become more popular than VLOOKUP?
Many companies have started replacing older lookup methods.
Unlike VLOOKUP, XLOOKUP can search in any direction and is easier to maintain when columns change. It also provides cleaner formulas and better error handling.
If your interviewer asks about lookup functions, mentioning both shows that you understand older and newer versions of Excel.
Question 7: What is a Pivot Table?
Instead of describing it as a feature, explain the business value.
Suppose a company records one lakh sales transactions during a year.
Reading every row individually would be impossible.
A Pivot Table summarizes the data within seconds, showing total sales by city, state, product category, or month without writing lengthy formulas.
That is why Pivot Tables are one of the most frequently tested topics during interviews.
Question 8: How does Conditional Formatting help businesses?
Imagine a sales dashboard with hundreds of numbers.
Finding poor-performing products manually would take time.
Conditional Formatting automatically highlights important values using colours, icons, or data bars, allowing managers to identify problems immediately.
It turns raw numbers into meaningful insights.
Question 9: Why is Data Validation useful?
Incorrect data creates incorrect reports.
Data Validation prevents users from entering invalid information by restricting what can be typed into a cell.
For example, a company may allow only valid department names or dates within a specific financial year.
This improves data quality before analysis begins.
Question 10: How do you clean messy Excel data?
Real interview tasks often involve cleaning data rather than writing formulas.
A structured answer could include:
- Remove duplicate records.
- Correct inconsistent spellings.
- Replace blank values where appropriate.
- Trim unnecessary spaces.
- Convert text into proper dates or numbers.
- Apply filters to identify unusual entries.
Demonstrating a systematic approach is more impressive than simply naming Excel tools.
Question 11: What is the purpose of sorting and filtering?
Sorting changes the order of records.
Filtering temporarily hides unnecessary information so you can focus on specific records.
For instance, a sales manager might filter only the North Region while leaving the complete dataset unchanged.
Question 12: What is the difference between relative and absolute references?
When formulas are copied across cells, Excel normally adjusts the references automatically. This is called a relative reference.
However, some values, such as tax rates or commission percentages, should never change. In these cases, absolute references keep the selected cell fixed throughout the worksheet.
Understanding this concept prevents many calculation errors.
Also Read- Looking for Advance Excel Course in Dehradun
Practical Excel Skills That Impress Recruiters
Candidates often spend too much time memorizing theory.
Interviewers are usually more interested in whether you can complete tasks such as:
- Creating a monthly sales report.
- Finding duplicate customer records.
- Preparing an employee attendance sheet.
- Building a Pivot Table.
- Designing a simple dashboard.
- Using lookup functions correctly.
- Organizing large datasets efficiently.
If you can perform these activities confidently, you are already ahead of many applicants.
Common Mistakes During Excel Interviews
Many candidates lose marks because they:
- Memorize definitions without understanding applications.
- Panic during practical tests.
- Ignore keyboard shortcuts.
- Forget basic formulas while trying to learn advanced topics.
- Spend too much time on one question.
A calm and logical approach usually leaves a better impression than trying to demonstrate every advanced feature.
How to Prepare in One Week
If your interview is approaching, divide your preparation into manageable sections.
Day 1: Excel interface and basic formulas.
Day 2: Logical functions and text functions.
Day 3: Lookup formulas and error handling.
Day 4: Sorting, filtering, and data cleaning.
Day 5: Pivot Tables and charts.
Day 6: Practice real interview datasets.
Day 7: Revise shortcuts and solve timed exercises.
This schedule builds confidence while covering the topics most employers expect.
Final Thoughts
Excel interviews are rarely about remembering textbook definitions. Recruiters want evidence that you can use spreadsheets to solve business problems efficiently. Focus on understanding concepts, practise with real datasets, and explain your reasoning clearly during the interview.
Whether you are applying for your first job or aiming for a more advanced role, strong Excel skills remain a valuable advantage. Continuous practice, rather than memorisation, is what ultimately helps candidates succeed in both interviews and the workplace.